

- GST No. 27AFNPK8304B1ZL
- Send SMS
- Send Email

| Business Type | Manufacturer, Exporter, Supplier, Retailer, Trader, Distributor, Importer |
| Automatic Grade | Automatic |
| Application | Weather Monitoring |
| Voltage | 3-6VDC |
| Click to view more | |
Product Details
Wire length
100-200mm
Weight
4000-8000gm
Model
WMS-51
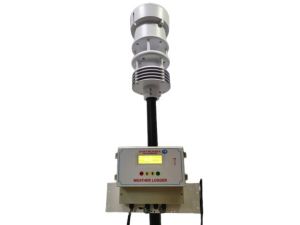
A weather monitoring station is a facility with instruments and equipment for measuring atmospheric conditions to provide information for weather forecasts and to study the weather and climate. It is available with Solar Panel and Mounting Accessories. The data is stored in a 2GB MicroSD card and also transmitted over to a central server through GSM/GPRS and data from this server can be downloaded into the PC. A GPRS activated sim card is required for data Transfer to network. Data from this network is available through internet irrespective of the location of installation. All the sensor are Davis, USA make.
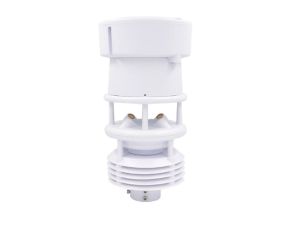
The Weather Monitoring Station Provides Measurement Options For
- Wind Direction
- Wind Speed
- Temperature
- Humidity
- Rainfall
- Solar Radiation
- Barometric Pressure
- Leaf Wetness
- Leaf Temperature
- Soil Temperature
WindEx Wind Rose And Wind Trend Plotting Software
Wind Rose & Wind Trend Plotting Software is an extremely simple tool to generate Wind Rose diagrams and Wind Trend plots from the data fetched by Instrumex Weather Monitoring Station. A wind rose is a graphical tool used to show wind speed and wind direction for a particular location over a specified period of time at a specific location. To create a wind rose, average wind direction and wind speed values are logged at a site, at short intervals, over a period of time, e.g. Every 5 minutes (In case of Instrumex Weather Station), 1 Hour, 1 Day or longer. The collected wind data is then sorted by wind direction so that the percentage of time that the wind was blowing from each direction can be determined. In case of Instrumex WindEx, the wind direction data is sorted into sixteen equal arc segments, 22.5° each segment, in preparation for plotting a circular graph in which the radius of each of the twelve segments represents the percentage of time that the wind blew from each of the twelve 22.5° direction segments. Wind speed data can be superimposed on each direction segment to indicate, for example, the average wind speed when the wind was blowing from that segment's direction and the maximum wind speed during the logging period.
.

.

Looking for "Weather Monitoring Station" ?
Piece


